
Autumn calving herd
Cornwall / 350 cows- 350
- Cows monitored
- 5p/L
- Feed cost improvement
- £59,500
- Additional value per year
Dairy IntelligenceResults
Understand the starting point, the changes made and how the outcome was measured. One farm at a time.
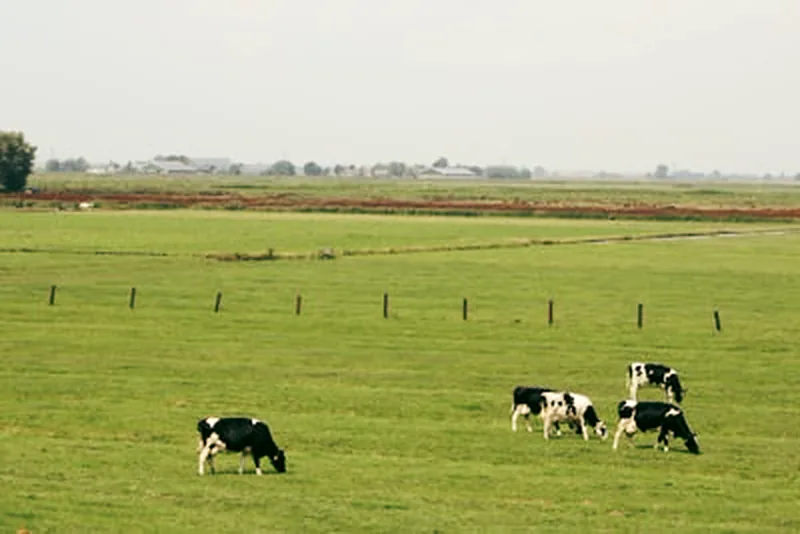
Each case below belongs to one herd. The figures are not pooled, and no number from one farm describes another.
We are writing up the measurement detail behind each figure: the period it covers, the starting point, what was changed and how the outcome was worked out. Ask us for the detail on any case here and we will talk you through it.
Measure what is there, read it together, change one thing at a time, and measure again.
The honest answer depends on where you are starting from. Tell us that and we will tell you what looks possible.